
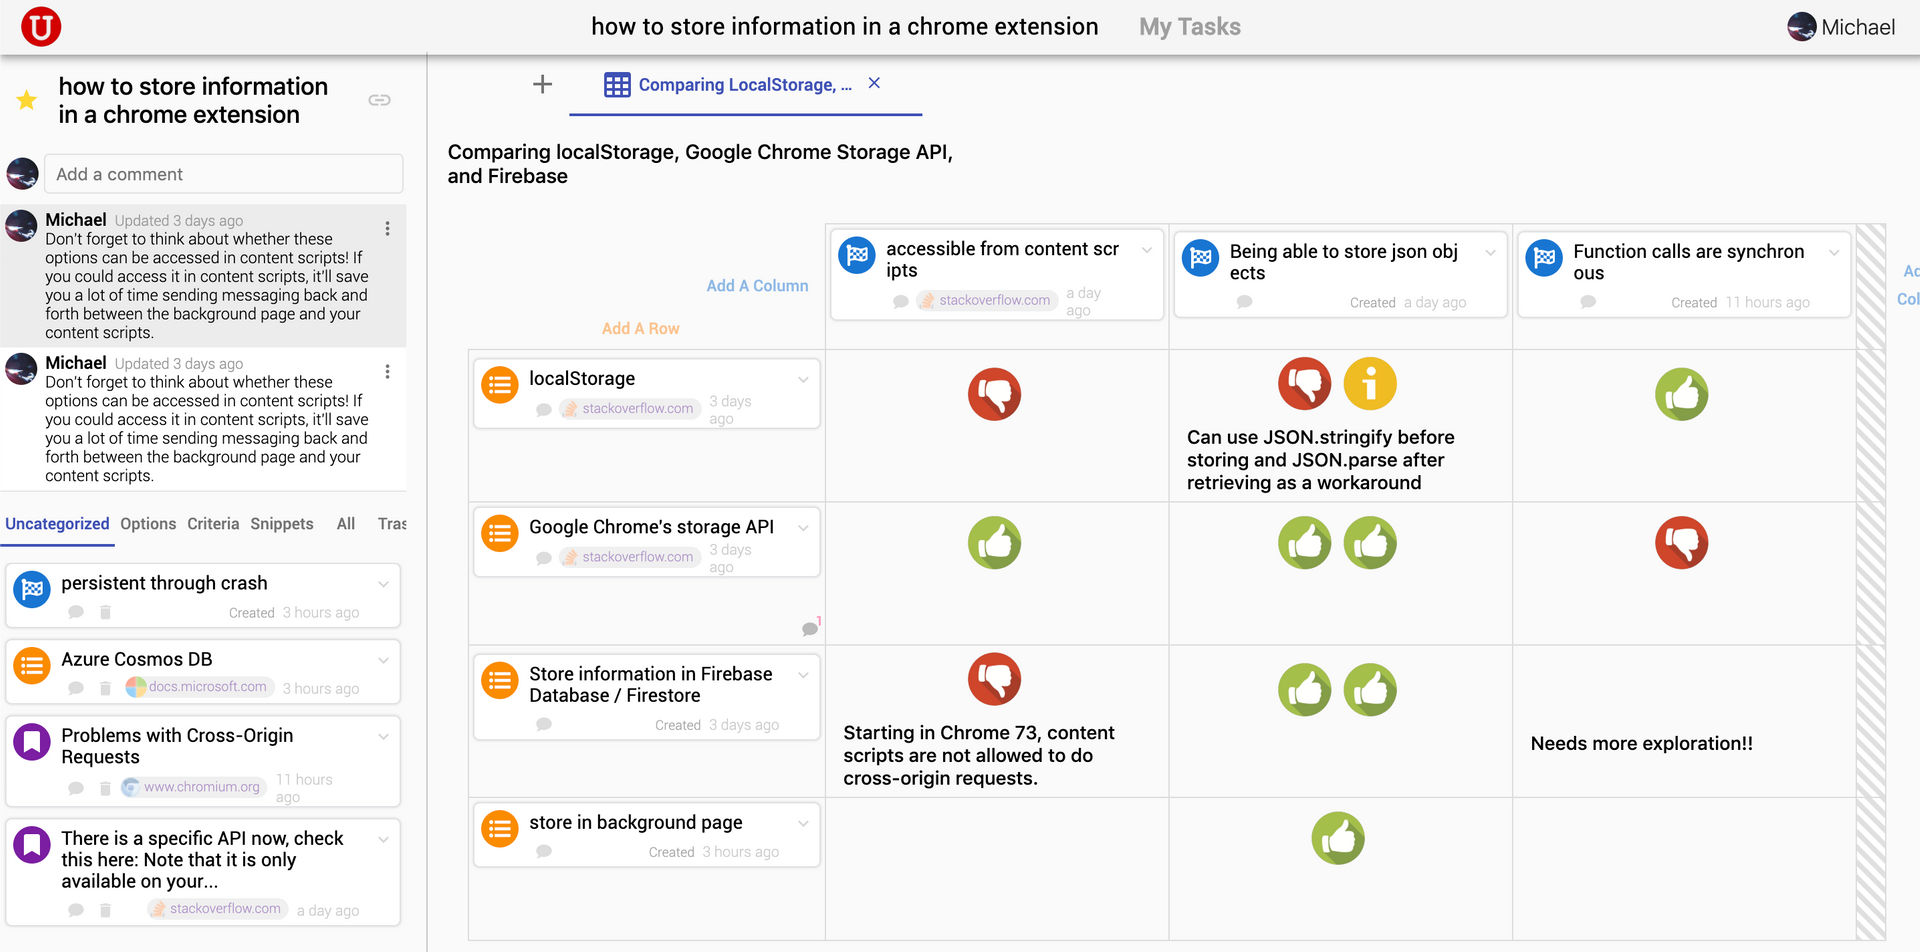
This project centers around the comparison table: a visual model that supports and documents a programmer’s information collection and decision making processes by forming a tabular representation of the problem space. The implemented comparison table has three major components:
- Option - every option/solution is represented by a row, and each is labeled in the row header
- Criteria - each criteria of the issue/problem is shown as a column, each labeled by a column header
- Snippets - pieces of html collections taken from webpages that users found when searching for a solution
These are gathered into a table into the following, where options can be rated to either fulfill or miss criteria. Each rating will be supported by a piece of evidence stored in a snippet.
Try out UNAKITE in the Chrome webstore!
My contributions
- User testing
- A/B testing to test if a comparison table actually enhances understanding over a raw Stack Overflow page (preliminary results were promising!)
- Manually analyzed SO questions to find that approximately half of them are adaptable to the tabular format
- I published and presented these findings at the 2018 VL/HCC conference!
- Did a bunch of scenario-based design thinking and wireframing, some of the ideation can be found below

|

|

|

|

|

|

|
Questions? Check out UNAKITE's website or documentation |